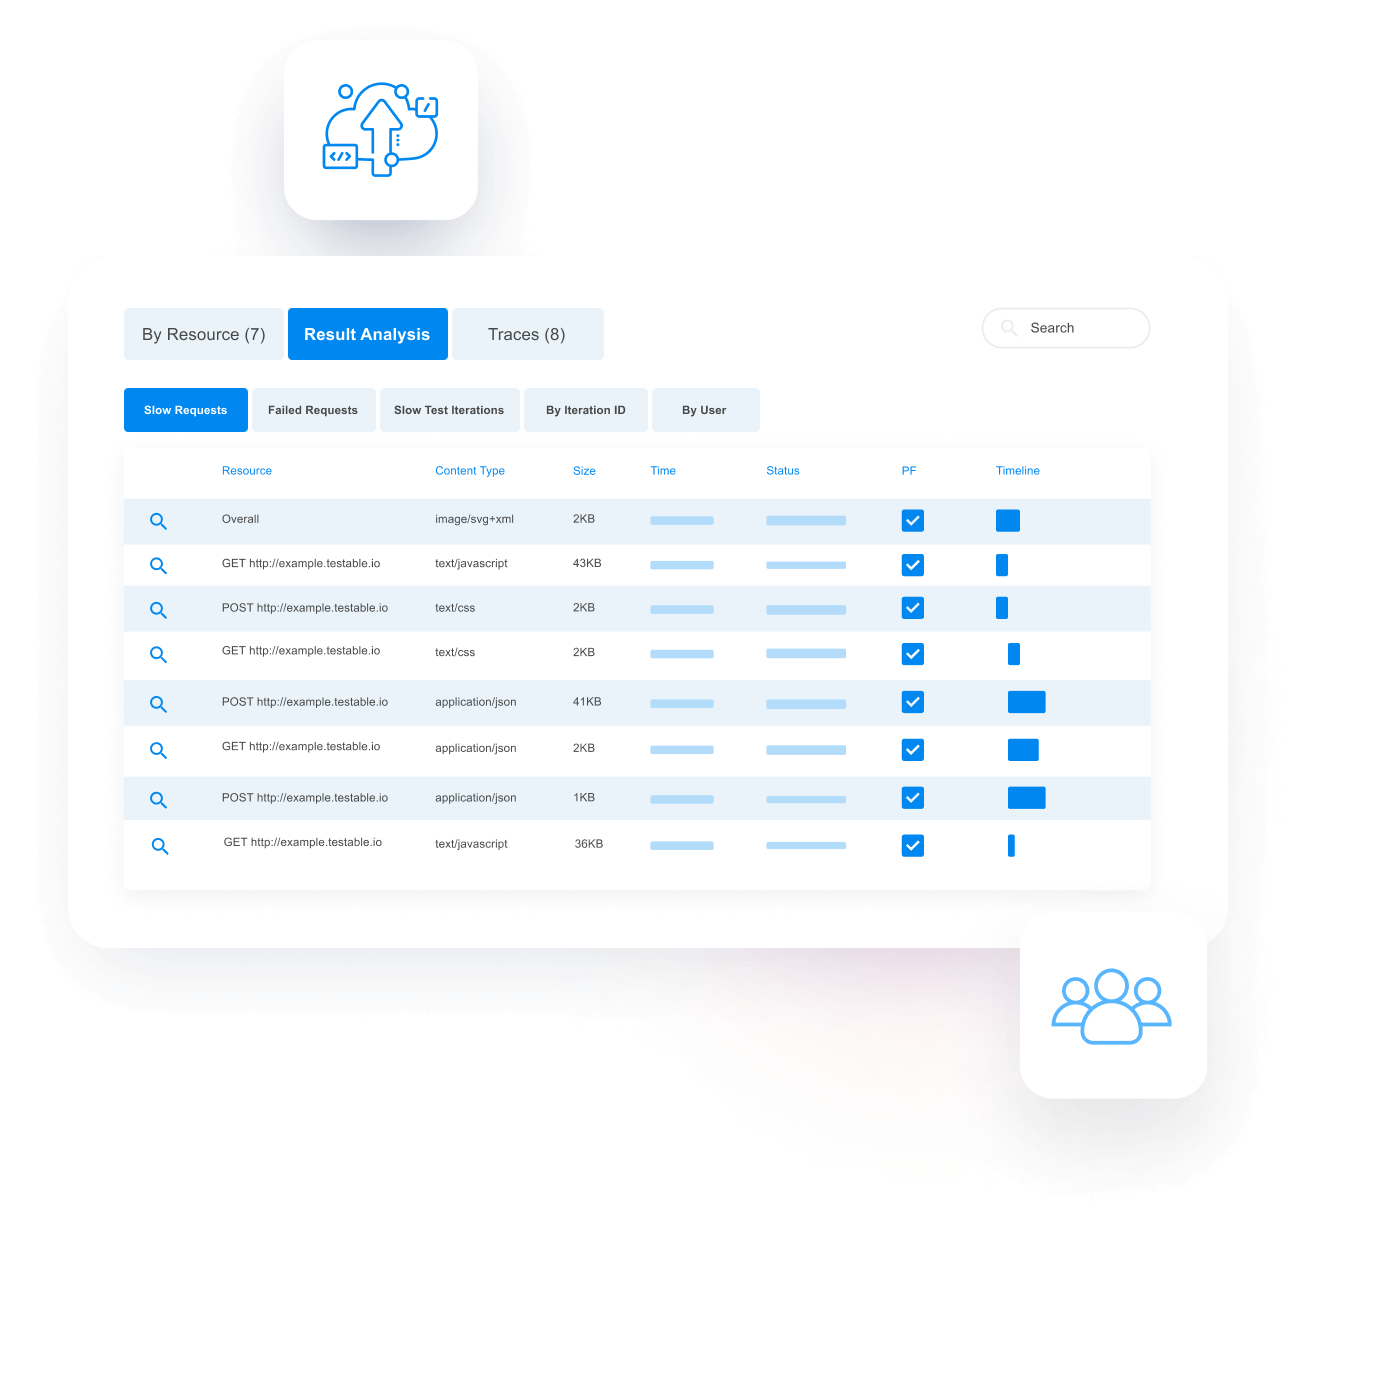
Products Features Use Cases Pricing Documentation Blog About
Schedule Demo
JMeter Test Automation

Run your JMeter tests on the Testable platform without having to make any changes while gaining many useful and time saving features to help you run and automate your performance tests.

Start Testing
Why Testable Cloud vs roll your own?
Testable’s API, test setup, execution, reporting, analysis and collaboration features add a lot of additional value to what you get from JMeter out of the box. Read on to learn more about each area.
Easy to bring both simple and complex test scenarios

Either upload a zip file with your test plan and other required artifacts (e.g. CSVs, jars, etc) to Testable or link Testable with your git repository. The git repo does not have to be publicly accessible or even hosted on a public git service. If you link Testable with git we will clone your repo onto each JMeter engine at test execution time.

Infinitely scalable distributed JMeter engines

Run a distributed test with as many JMeter engines as your tests require without a master node becoming the processing bottleneck.

Testable does not rely on JMeter’s master/worker technology. Testable’s proprietary distributed grid runs each JMeter engine independently. Each test runner reports results via a highly efficient binary protocol to an infinitely scalable test processing service that aggregates them together for real-time reporting and analysis.

Automated JMeter engine provisioning across the globe
  • Run your test across 100+ cloud regions on AWS, Azure, and Google Cloud or on-premises.
  • Test runners can be automatically spun up at the start of your test and terminated at the end. Alternatively setup long running test runner grids to run multiple tests.
  • Automated infrastructure spun up in our cloud accounts or yours. Simply grant us enough access and we automate the rest. Non-public applications inside your private network can be tested with zero infrastructure setup before the test.
  • For on-prem, spin up our self-host test runners on any Docker or Kubernetes enabled infrastructure. No connection IN from Testable to the test runner container is required.
Integrate into your continuous integration and deployment pipelines
Use our simple API to integrate and automate your JMeter tests in a simple script with just a few lines.
We provide examples of how to integrate Testable as a GitHub Action, into your GitLab pipeline, AWS CodePipeline, Jenkins, and more.
Define success criteria to automate the determination of test success allowing you to confidently insert Testable into your continuous deployment pipelines.
Capture useful information not included in standard JMeter reports

All charts, metrics, and aggregations available in JMeter reports are also available on Testable. We also capture several additional items:

Traces

A full trace includes all metrics, and a timeline view of the request that includes all request/response headers + body. Testable intelligently samples to ensure you have at least one example for every combination of URL + response code but without capturing so many traces that it affects the test performance. Having these traces can be really useful to analyze and debug application errors.

Raw Results

Export the raw results (i.e. one row per request) to a CSV. Scales up to millions of requests without affecting the test performance. Do your own offline aggregation and analysis as required.

Analysis Tools

Testable offers a variety of analysis tools:

  1. Trend analysis across test runs
  2. Comparison vs your baseline run
  3. View the slowest or failed requests
  4. View the requests by engine, user #, and iteration

Output Files

Any files your JMeter tests write to a special directory will be captured and made available for download in your test report. So if you want to generate a JMeter report for example, simply write it to the special directory (${__P(output_dir)}/filename) and it will appear in real-time in your test results.

Real-time, aggregated, customizable, shareable reporting across JMeter engines
View and customize test reports for a test run or a test history. See metrics, charts, trends, anomalies, videos, screenshots, traces, assertions, and more. Drill down by region, target URL, and more. Use the report to deep dive and debug issues. Generate a share link or export your report to PDF/CSV/JSON.
Generate a comparison report between any two test results to see exactly what changed.
Mark a specific test run as the baseline (i.e. gold standard) that all other runs will be compared against to detect anomalies.
Success criteria and notifications
Set your criteria for test success in a variety of ways:
  • Some examples include:
    • 95 %ile response time < 500ms
    • Bandwidth utilization is no more than 25% above the baseline run
    • Success rate > 99%
    • Median response time does not spike minute over minute.
  • Success criteria can be evaluated at the end of the test or actively during the test, stopping on failure.
  • Get notified via email, SMS, and WhatsApp when a test starts, succeeds, and/or fails. Customize notifications as required.
All the enterprise ready features your team expects
Our enterprise features include Single Sign On (SAML), entitlements, multiple team onboarding, 24/7 customer support, professional services, customer encryption keys for test data, and more.
Start Testing